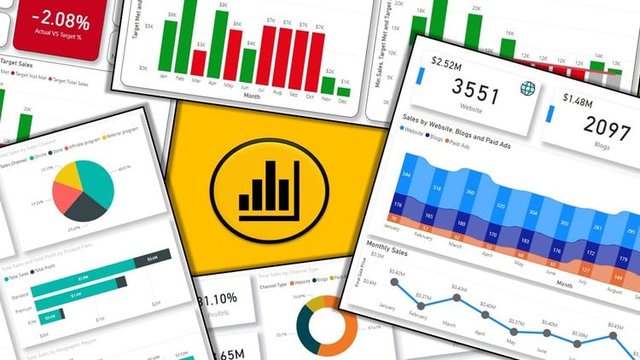
Power Bi Bootcamp: From Raw Data To Reports With Dax/visuals
Published 7/2025
Created by Ashraf TP Mohammed
MP4 | Video: h264, 1280x720 | Audio: AAC, 44.1 KHz, 2 Ch
Level: Beginner | Genre: eLearning | Language: English | Duration: 51 Lectures ( 4h 52m ) | Size: 2.81 GB
Introduction to Power BI: Understanding what Power BI is, its features, and its benefits for data analysis and visualization.
Setting up Power BI Desktop and understanding its interface.
Connecting to various data sources such as Excel spreadsheets, databases (SQL Server, MySQL, etc.), online services (like SharePoint, Dynamics 365, Google Analy
Cleaning and shaping data using Power Query Editor, including tasks like renaming columns, removing duplicates, splitting columns, and creating calculated colum
Requirements
Basic knowledge of Excel, particularly understanding how to work with spreadsheets and data, can provide a good foundation for learning Power BI.
Some familiarity with basic data concepts like tables, rows, columns, and data types can be beneficial.
Basic Database Knowledge: While not mandatory, having a basic understanding of databases and SQL concepts like tables, queries, and relationships can be helpful.
Analytical Thinking: A mindset for problem-solving and analytical thinking is crucial for effectively analyzing data and creating meaningful visualizations.
Description
Welcome to the Power BI Bootcamp: From Raw Data to Reports with DAX/Visuals - your complete, hands-on guide to mastering Power BI from the ground up.This course is designed to help you develop practical, job-ready skills in data analysis, modeling, and visualization using Power BI. Whether you're a beginner just starting your data journey or a professional looking to sharpen your BI capabilities, this course has you covered.You'll learn how to:Connect to and clean data from multiple sources using Power QueryBuild efficient data models and create relationships between tablesWrite powerful DAX formulas for calculated columns and measuresDesign interactive reports and dashboards with stunning visualsApply best practices for data storytelling and report performancePublish and share reports securely via the Power BI ServiceWith real-world examples, step-by-step guidance, and plenty of hands-on exercises, you'll gain the confidence to solve business problems with data and present insights clearly and effectively.By the end of this course, you'll not only know how to use Power BI-you'll know how to use it professionally.Join today and start transforming raw data into valuable insights that drive decisions and make a real impact. Will develop report from real world use cases and data sets
Who this course is for
Individuals working in business roles such as marketing, finance, sales, operations, or human resources who need to analyze data to make informed decisions.
People interested in data analysis as a career or hobby, including those who want to transition into roles focused on data analytics.
Students studying fields like business, economics, statistics, or any other discipline involving data analysis.
Those running their own businesses who want to leverage data to understand their customers, operations, and performance better.
IT professionals who want to learn how to leverage Power BI for data visualization and reporting purposes within their organizations.