Google Earth Engine: Algae Bloom Analysis Seasonal Changes
Published 7/2025
Created by Micah Kutoto
MP4 | Video: h264, 1280x720 | Audio: AAC, 44.1 KHz, 2 Ch
Level: Beginner | Genre: eLearning | Language: English | Duration: 26 Lectures ( 3h 33m ) | Size: 1.55 GB
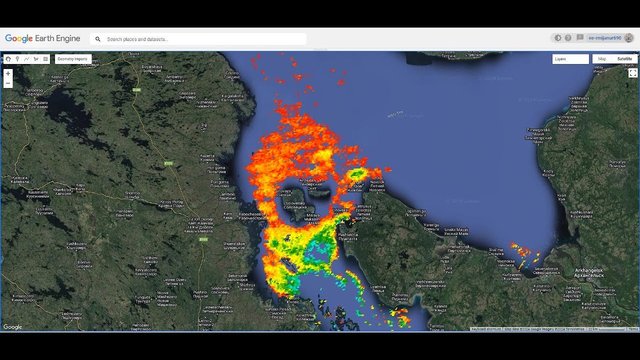
Analysis of Seasonal Changes of Algae bloom in Lake Elementaita using Google Earth Engine. GIS and Remote Sensing.
What you'll learn
Understand advanced concepts about Google Earth Engine.
Learn how to perform Analysis in Google Earth Engine.
Perform Spectral Index Calculation for Analysis.
Complete a case study about Algae Blooms.
Basics of Google Earth Engine and its JavaScript API.
Importing, filtering, and visualizing satellite imagery.
Creating custom algae bloom detection algorithms.
Using spectral indices to monitor water quality.
Time-series and trend analysis of bloom events.
Requirements
You need basic understanding of Programming. Familiar with JavaScript Google Earth Engine. Basics of Geospatial Data Analysis.
Description
This course provides a comprehensive, hands-on introduction to detecting, monitoring, and analyzing algae blooms using the powerful cloud‑based platform Google Earth Engine (GEE) and its JavaScript API. You'll gain practical experience harnessing satellite imagery-such as Sentinel‑2 and CHIRPS Rainfall Data-while learning to apply advanced spectral indices, including NDTI, NDWI, and Chlorophyll‑a proxies, to quantify water quality and vegetation health. Throughout the course, you'll learn to create dynamic time‑series visualizations, geospatial overlays, and interactive maps that reveal both spatial and temporal patterns of harmful algal blooms (HABs) in diverse environments, spanning freshwater lakes, rivers, reservoirs, and coastal zones.Using a series of real‑world case studies, you'll develop automated remote sensing workflows that streamline data collection, processing, and analysis-all performed directly in the browser. This approach enables you to swiftly generate downloadable outputs, reports, and geo‑referenced maps suitable for environmental monitoring, academic research, or government policy and resource management.By the end of the course, you'll confidently navigate GEE's interface, write modular JavaScript code, design reusable algorithms, and interpret complex results. Whether you're an environmental scientist, GIS professional, graduate student, or policy advisor, you'll come away with the skills to apply satellite-driven insights to address pressing water quality and ecosystem health challenges.
Who this course is for
This Course is meant for Beginners in Google Earth Engine. Environmental scientists and researchers interested in aquatic ecosystems. Remote sensing and GIS professionals looking to expand their geospatial skills. Students in environmental science, ecology, hydrology, or geoinformatics. NGOs and government agencies involved in water resource management. Anyone interested in leveraging satellite data to combat the threat of harmful algal blooms.